Research it. Backtest it. Then let it run.
Declarative strategies, years of exchange data, and a managed runtime — behind one login. Start free in under a minute. No card, no install, no VPS.
Free tier stays free · Cancel anytime · Whale & SMC included with Pro
- 7 exchanges ingested
- BTC · ETH · SOL · XRP · XAU
- ~2s refresh
- Nothing to install
Measured every year, not just the good one.
Backtests on OKX perpetual futures, over the same candles the live bots trade. Each column is a separate year, run on its own data — because a strategy that only worked once is not a strategy. Open any row to read the trades behind it.
These are the reference strategies that ship with the platform. A strategy you build yourself is measured against the same exchange candles, with funding, fees and slippage charged the same way.
6 of 8 profitable in every year measured
25% sizing
Updated 2026-11-07 00:26 UTC
| Strategy | Nov 25 – Nov 26 | 2025 | 2024 | |
|---|---|---|---|---|
| konis v63x · 7.5% per positionlong +28.18% · short +43.12% | +82.96%201 trades · 18.2% dd | +258.35%232 trades · 18.8% dd | +176.58%215 trades · 19.1% dd | |
| konis v4long +17.83% · short +59.95% | +101.54%189 trades · 12.7% dd | +176.34%218 trades · 12.2% dd | +81.81%189 trades · 22.5% dd | |
| konis v3long -14.20% · short +55.80% | +26.48%160 trades · 15.6% dd | +109.24%159 trades · 7.8% dd | +66.13%145 trades · 25.3% dd | |
| BinH & Cluclong +23.37% · long only | +8.73%198 trades · 5.3% dd | +1.68%385 trades · 23.0% dd | +26.81%422 trades · 9.1% dd | |
| BinH & Cluc V4long +19.87% · long only | +11.49%180 trades · 8.4% dd | +11.21%310 trades · 14.8% dd | +22.72%341 trades · 10.5% dd | |
| BinH & Cluc V5long +15.47% · long only | +12.49%188 trades · 5.0% dd | +3.16%321 trades · 11.4% dd | +21.46%354 trades · 10.1% dd | |
| BinH & Cluc V5 (tuned)long +10.01% · long only | +8.37%145 trades · 6.7% dd | -0.09%275 trades · 12.8% dd | +20.74%341 trades · 10.5% dd | |
| BinH & Cluc 2021long +32.18% · long only | +13.25%216 trades · 4.9% dd | -5.79%368 trades · 27.3% dd | +15.87%396 trades · 15.0% dd |
Backtested on ADA, ALGO, AVAX, BNB, BTC, CRV, ETH, ICP, SOL, SUI, XRP. Last measured 2026-11-07. Each position commits 25% of the balance, unleveraged. Past performance does not predict future returns. A backtest is a simulation, not a record of money made.
Drag it together. The engine tells you if it runs.
No Python, no VPS, no container. Pick indicators, write the conditions, and the same loader that runs live trading accepts or refuses the document as you type — so anything it accepts here is something it will actually run.
- 36 indicators, including CHoCH, order blocks, fair value gaps and sessions
- 100+ pairs, kept current every 5 minutes on the candles the live bots trade
- Funding, fees and slippage charged — and the report says what it could not measure
- Watch it run live in analysis-only mode before a single order is placed
Building strategies, charting them and backtesting them are free and unlimited. A plan buys real-time data, live execution and the API — never the right to measure your own rules.
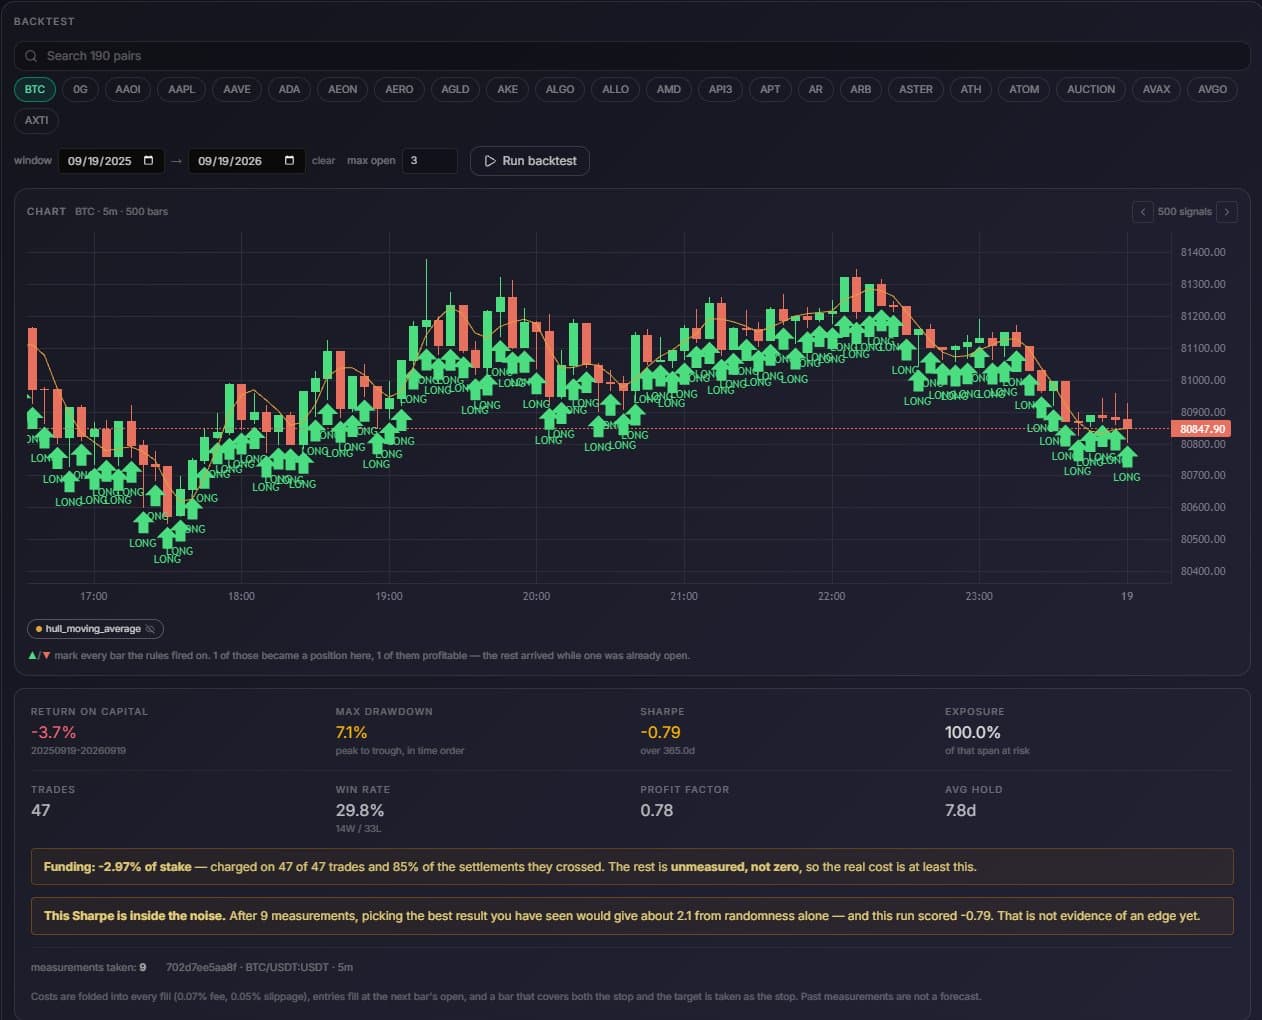
when This is what a finished backtest looks like.
A real run, screenshot and all — one year of BTC at 5m. It lost 3.7%, and the report says so in the same size type it would have used for a win. Nothing here is the good screenshot.
- Every bar the rules fired on
- Arrows mark all of them, not just the ones that became trades — so you can see the difference between rules that rarely trigger and rules that trigger constantly while a position is already open.
- Funding, charged and counted
- Real settlement data, per trade. Where a rate is missing the report says how many trades it could not price rather than charging those zero and calling the total complete.
- A noise band on the Sharpe
- Run a strategy enough times and something will look good by chance. The report tracks how many measurements you have taken and says when the best of them is still inside what randomness would produce.
- The cost model, in the open
- 0.07% fees, 0.05% slippage, entries filled at the next bar's open, and a bar covering both the stop and the target counted as the stop.
A backtest is a simulation over past candles, not a record of money made, and not a forecast.
One login. Six ways to read the same market.
Backtesting, market analytics, structure computation and a hosted runtime are four different jobs. One login covers all of them.
Analytics and Trading Bots
Run a backtested strategy on live OKX candles in analysis-only mode, or let a trading bot run it on your own exchange account. Every strategy measured over a full year, long and short reported separately.
市场分析
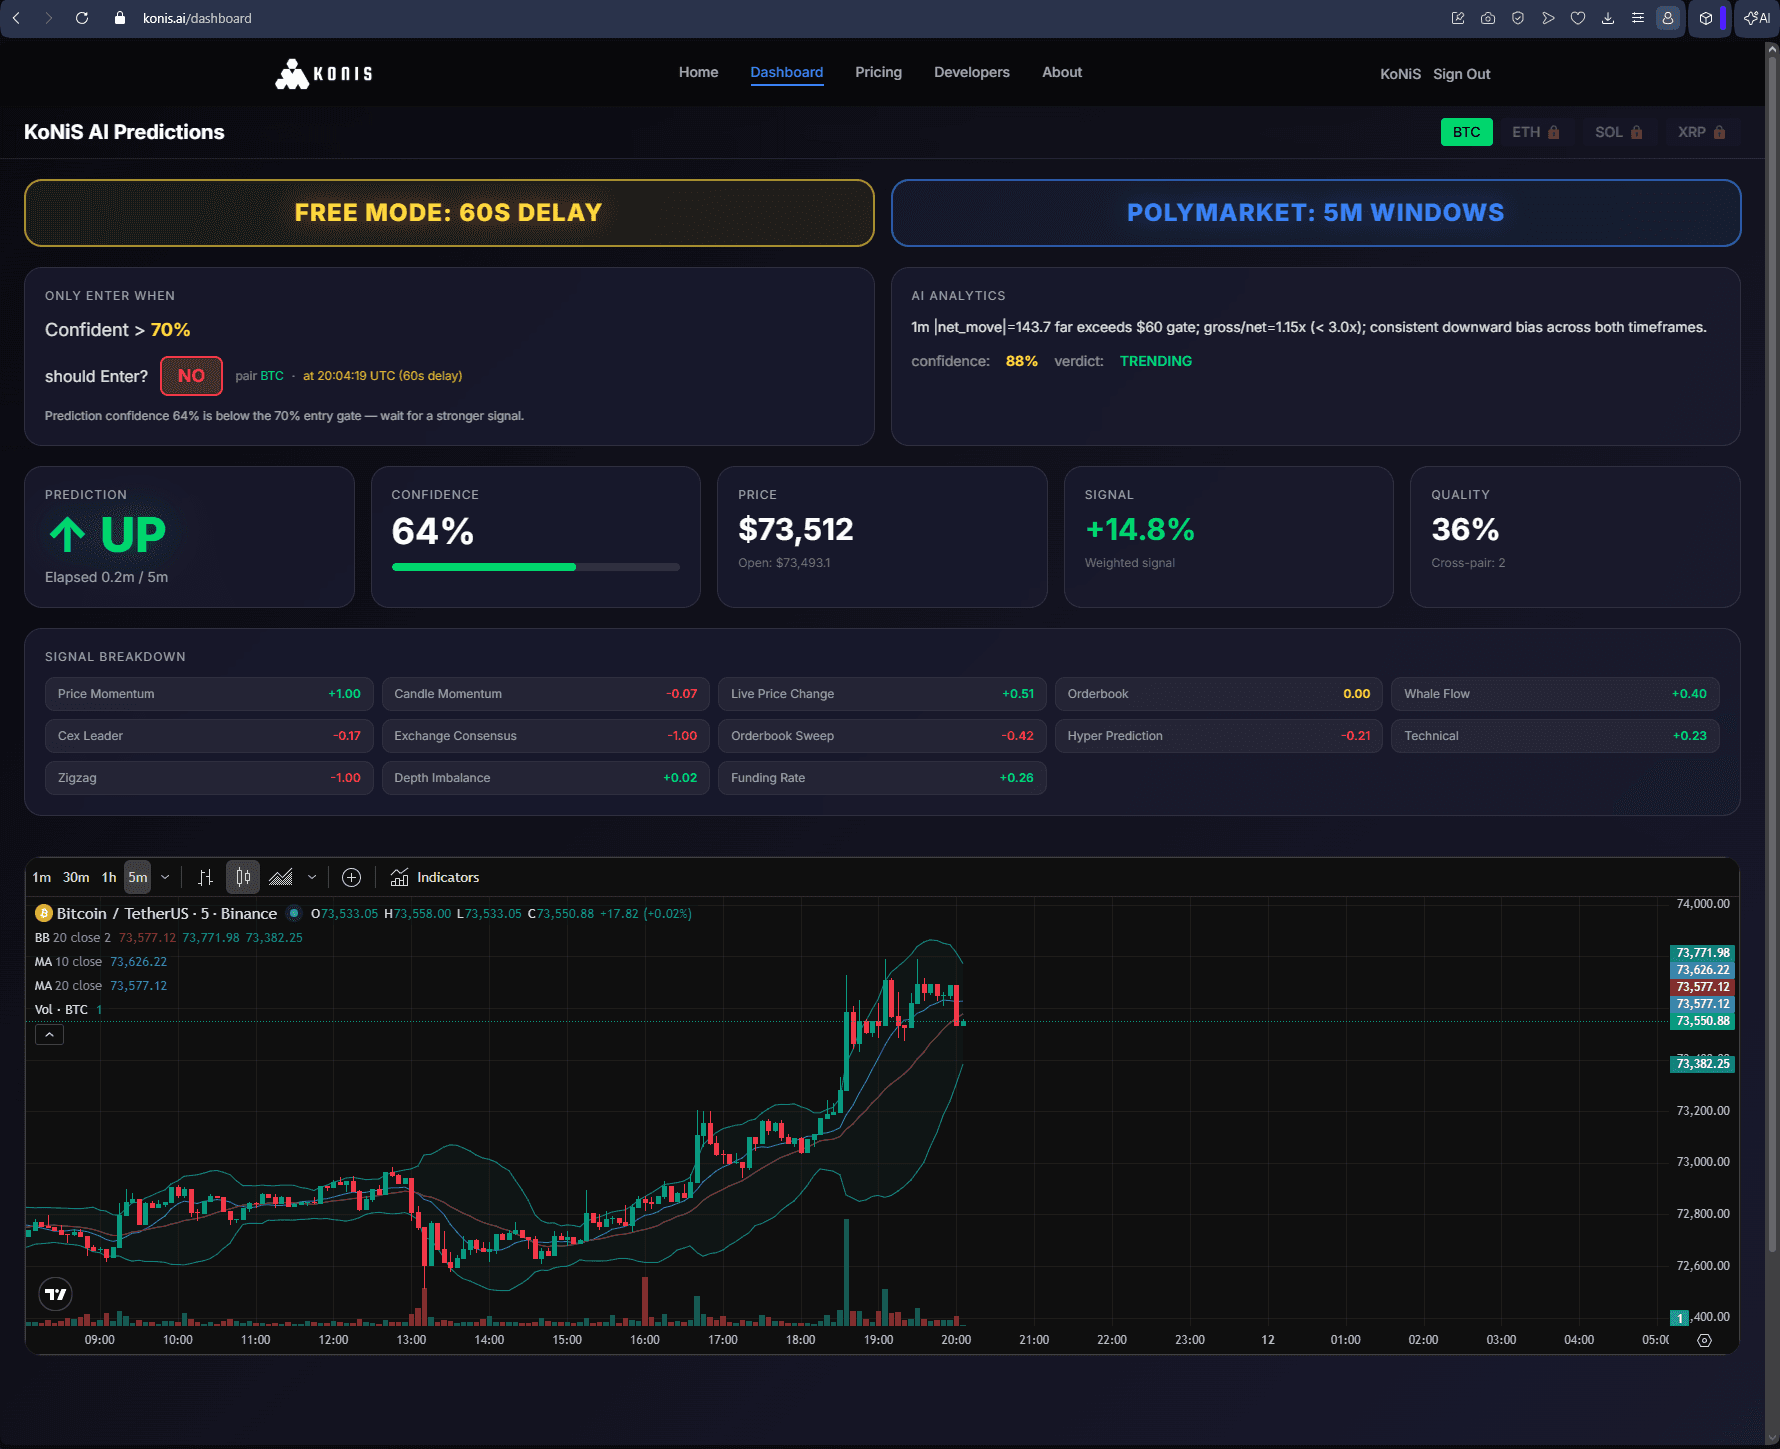
Thirteen market factors from seven exchanges, reduced to one directional read with a quality score, beside a TradingView chart. Analytics, not instructions.
Whale Dashboard
Live whale positions, liquidation shelves and multi-exchange order flow — see where size is actually sitting before price reacts.
SMC Dashboard
Smart Money structure computed live — BOS/CHoCH, order blocks, fair value gaps, and the levels those structures imply, already measured.
AI Watchdog
A regime classifier that says NO. Every 15 seconds it grades the tape TRENDING or CHOPPY, so you sit out the setups that quietly bleed accounts.
Quant API
JSON analytics and regime endpoints at up to 200 requests/second, with managed API keys. Wire the raw feed into your own stack.
Retail reads the chart. Whales move it.
Price is the last thing to tell you what happened. The Whale Dashboard shows the positioning underneath it — who is loaded, which liquidation shelves are stacked above and below, and where flow is concentrating across the venues we ingest. It refreshes on its own: no install, no exchange key, no terminal.
- Live whale positioning and order flow
- Liquidation zones and history per symbol
- Multi-exchange order flow across every venue we ingest
- Top movers ranked on 5m and 15m windows
- Refreshes on its own — nothing to install, no API key
Included in Pro, Live and Quant · Cancel anytime
Your levels, drawn before you open the chart.
Marking structure by hand costs the first twenty minutes of every session, and the lines still get second-guessed. This computes them live on aggregated 1m candles for BTC, ETH, SOL, XRP and XAU: structure bias, displacement-validated order blocks, unfilled gaps, and the levels those structures imply with the R:R already attached.
- Market structure bias with break-of-structure and CHoCH events
- Order blocks validated by ATR displacement and liquidity sweeps
- Fair value gaps plus equal-high / equal-low sweep levels
- Levels, invalidation and targets derived from the structure
- BTC, ETH, SOL, XRP and XAU on aggregated 1m candles
Included in Pro, Live and Quant · Cancel anytime
Three reads, one screen
Direction, positioning, structure. Most desks compute one of the three. This computes all three and shows its working.
- 01
Read the market
The analytics dashboard reduces thirteen market factors to one directional read with a quality score, and the regime classifier grades conditions TRENDING or CHOPPY every 15 seconds.
- 02
Check who is on the other side
Whale flow shows where size is positioned and which liquidation shelves are stacked. SMC computes the structure, the order block, and the levels that follow from them.
- 03
Decide for yourself — the strategy and the limits are yours
Every decision is yours. Manual traders keep their keys entirely; bot users connect their own exchange key and set the strategy, pairs and limits themselves. The analytics keep updating afterwards, so a position can be managed against the same structure it was opened on.
This is what you get on day one
No demo build, no sandbox data. This is the screen your account opens into.
市场分析
Regime verdict, the thirteen-factor breakdown, the live directional read and a TradingView chart — all on one page.
Start on Free. Upgrade when you go live.
Four tiers, each a superset of the one before it. Authoring and backtesting are free and unlimited — you pay for real-time data, live execution and the API.
通过 PayPal、信用卡或加密货币(Polygon)按月付款。随时取消。
Your research, on infrastructure you don't maintain.
Backtest against years of exchange data, run what survives, and read the market while it runs. Free account, one minute, no card.
KONIS is technical software and market analytics. It is not financial, investment or trading advice, and nothing here is a recommendation to buy or sell anything. Outputs are probabilistic — a 70% confidence read is wrong 30% of the time. Backtested results are historical and do not indicate future results. You make every decision yourself. Trading carries substantial risk, including total loss of capital. Never commit funds you cannot afford to lose.
常见问题
平台做什么、如何收费,以及明确不做什么。