User Guide
How KONIS works, screen by screen
Seven features, ordered by what people ask about first. Each one gets the same treatment: what the screen is for, a picture of it, what every panel on it means, the workflow in order, and the numbers you need to know to read it correctly.
Sign in first
Every screen below lives behind sign-in. Creating an account costs nothing and opens the prediction dashboard on BTC straight away.
The rail on the left is the map
Dashboards at the top, bots under Bots, keys under Quant. A padlock means a plan does not include that surface — never that something is broken.
Nothing here is advice
These screens publish readings and run what you tell them to run. Every decision, and every position, stays yours.
Bots
Your Strategies
Write a strategy, measure it, watch it. Free, and it places no orders.
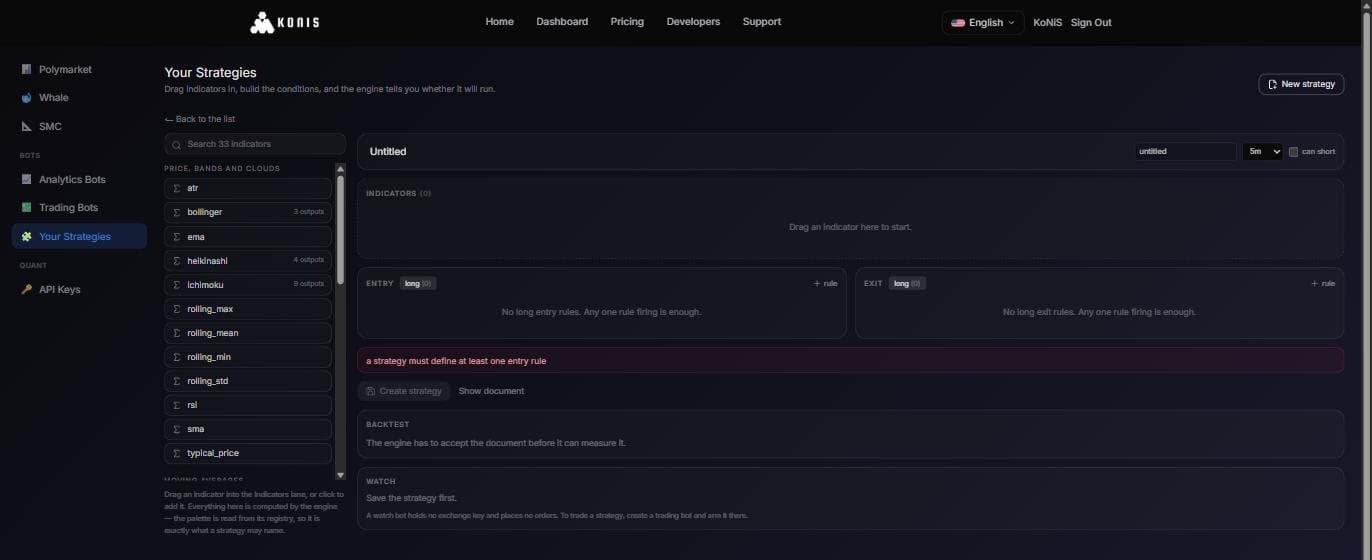
A builder where you drag indicators in, name the conditions that open and close a position, and the engine tells you as you type whether it will run what you have written.
A saved strategy can be measured over historical candles and then watched live by a bot that holds no exchange key. Writing and measuring cost nothing — what a plan sells is the running.
On the screen
- Indicator palette
- Every indicator the engine can compute, searchable and grouped. Alongside the moving averages and oscillators are the smart-money ones — change of character, order blocks, fair value gaps and trading sessions — so a structure strategy can be written here without leaving for a charting tool.
- Indicators lane
- One card per indicator: an editable column name, the function, parameter boxes showing the engine's defaults as placeholders, and the output column names your rules will refer to.
- Entry and exit lanes
- Long and short tabs with their rule counts. Each rule has a name — which becomes the entry tag you will see on charts and in trade history — and rows that read when column, operator, value.
- The verdict line
- A live check against the engine. Either it accepts the document and shows a twelve-character version id, or it names the field it rejected and why. There is no second opinion in the browser to disagree with it.
- Show document
- Reveals the YAML your lanes produced, which is what actually gets run.
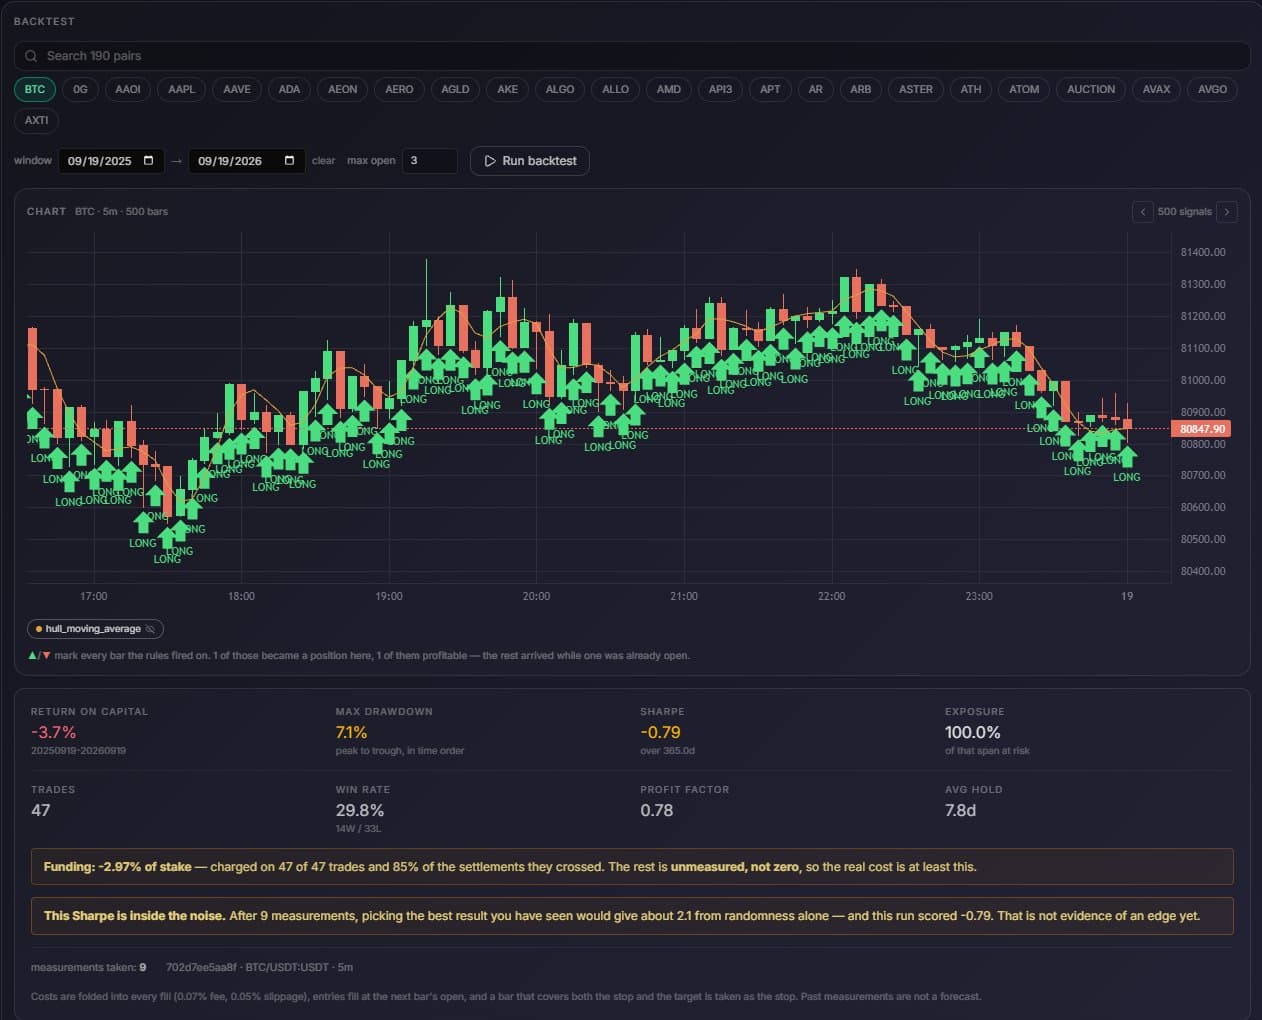
- Backtest panel
- Pairs in the exchange's own notation, a date range, and how many positions may be open at once. It only opens once the document is both accepted and saved.
- The report
- What a finished run leaves behind: the chart with an arrow on every bar the rules fired on and a line saying how many of those became positions, then return, drawdown, Sharpe, exposure, trades, win rate, profit factor and average hold. Under them sit the two things a backtest usually hides — what funding cost, and how much of that cost it could not measure — and, when the figure is inside the noise band for the number of runs you have taken, a banner saying so.
- Watch panel
- Pick pairs and start a watch bot. It reports which version it is running, and warns you if you have edited the strategy since.
Step by step
- 1New strategy. Add indicators, and rename their columns if the defaults are hard to read.
- 2Write entry rules. Conditions inside one rule are ANDed; separate rules in a lane are ORed, so any one rule firing is enough.
- 3Watch the verdict line. Save stays disabled until the engine accepts the document.
- 4Save, then backtest: up to eight pairs, a date range, and a limit on concurrent positions.
- 5Read the report as a measurement rather than a result. If the Sharpe figure sits inside the noise band for the number of trials you have run, the report says so in a banner.
- 6Start a watch on the pairs you care about. To trade a strategy, create a trading bot and arm it there — a watch bot has no key and no way to order.
What the numbers mean
- Version id
- Saving creates a new immutable version. Editing never moves a bot that is already running; you stop it and start it again to pick up what is on screen.
- Measurements taken
- The list counts them per strategy on purpose. A figure picked out of fifty attempts is a weaker claim than the same figure on the first, and the count is the only thing that lets a reader tell those apart.
- The cost model
- Backtests charge 0.07% in fees and 0.05% in slippage, fill entries at the next bar's open, and treat a bar that covers both the stop and the target as the stop. Funding is charged per trade from real settlement data, and the report names how many trades it could not find rates for rather than charging those zero and calling the total complete. Past measurements are not a forecast.
- Not enough to say
- When there is too little data to support a headline figure, the report shows that sentence instead of the figure. No number at all is the honest output there.
- Limits
- Twenty strategy documents per account, eight pairs per backtest.
Building a strategy and drawing it on a chart are free and unmetered — that is how you find out what your rules do. What is metered is the measuring: three backtests per account, counted for life rather than per strategy or per month, after which any active plan lifts the cap. Watching stays free, because a bot that cannot order cannot cost you anything.
Open Your Strategies →Bots
Trading Bots
Real orders on your own exchange account — starting on paper.
A trading bot places orders on your own exchange account through an API key you add. Every bot is created in paper mode, and going live is a separate action you take later, from the list, after a confirmation that names the exchange and the key.
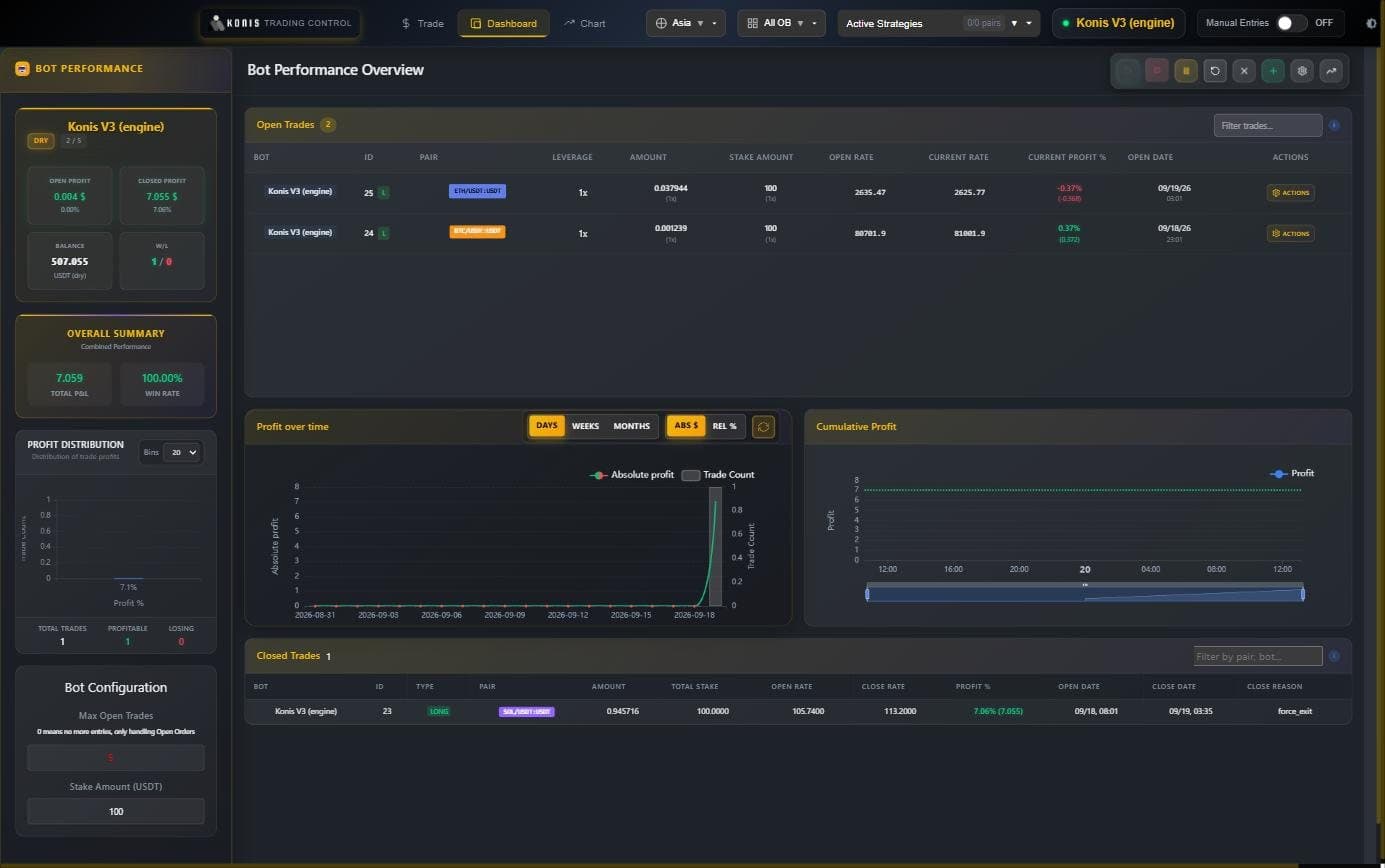
Each bot also has its own full control panel — open trades, closed trades, charts and configuration — which opens in a new tab already signed in.
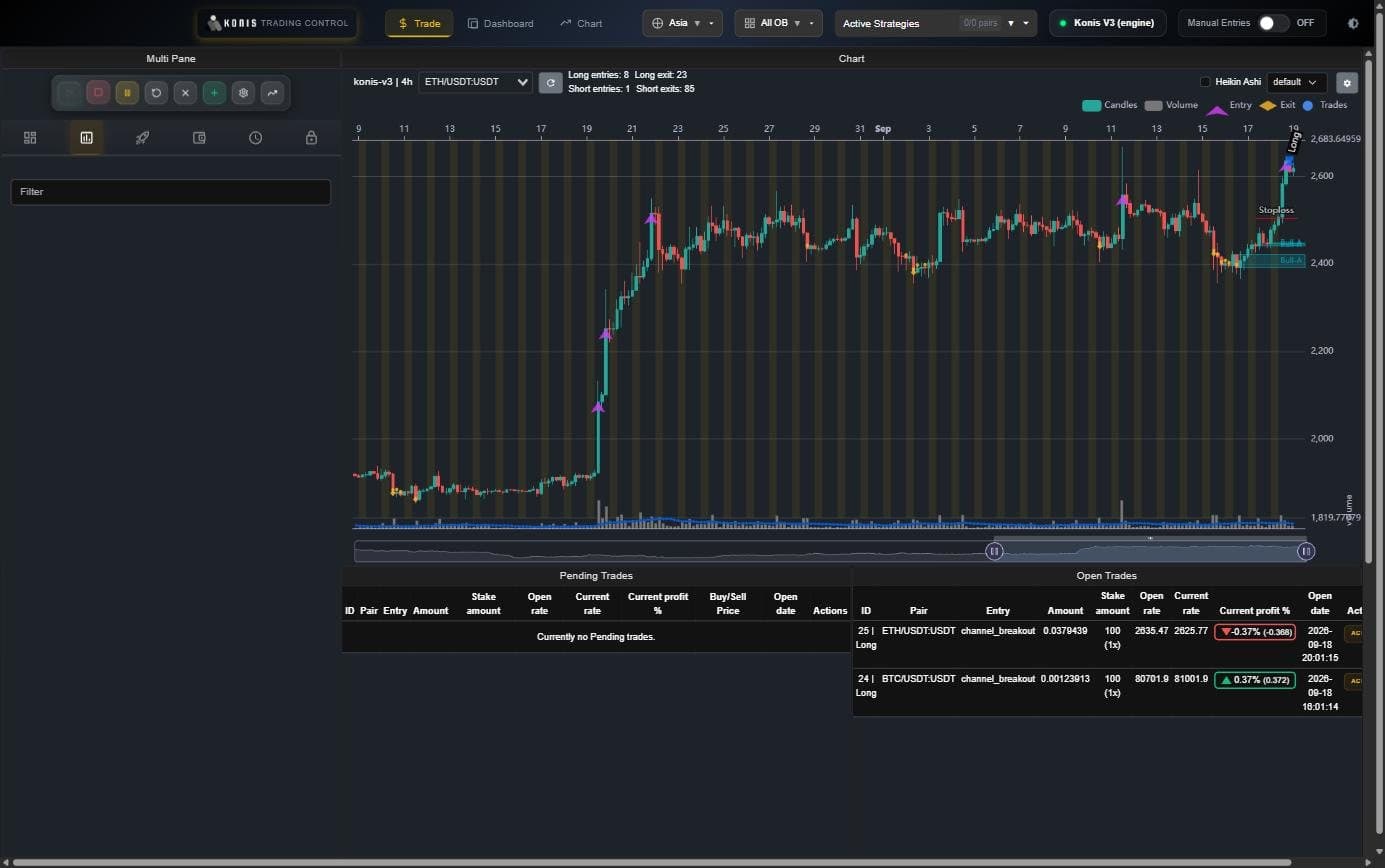
On the screen
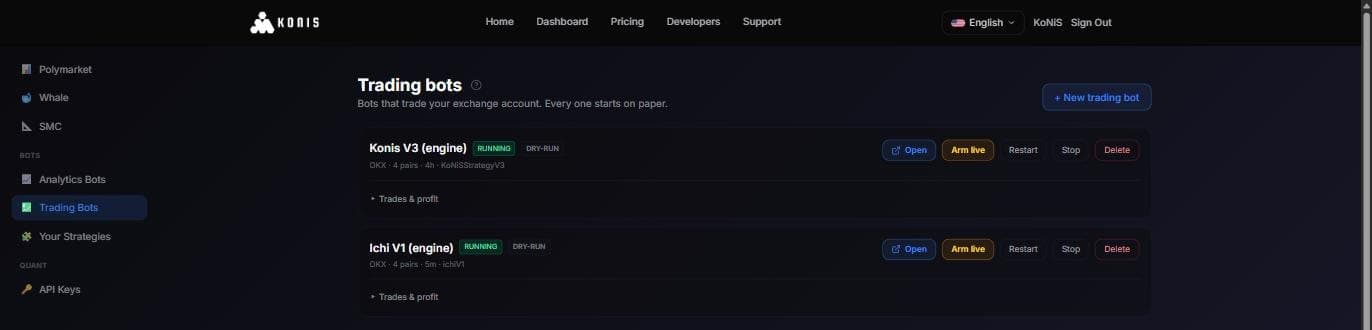
- Status and mode badges
- Running, stopped or error, and always LIVE or DRY-RUN beside it. Then the exchange, pair count, timeframe and strategy codes.
- Open
- The bot's own control panel in a new tab, already signed in. Enabled only while the bot is actually running.
- Edit
- Change the bot's name, its pairs and every sizing and risk field, then save. The bot restarts so the new configuration takes effect, and keeps its open trades and its history. The strategy and the exchange key are not editable — a bot is pinned to the strategy version it was paper traded on.
- Arm live / Disarm
- The only switch between paper and real money. Arming asks for confirmation and names the exchange and key; disarming takes effect immediately.
- Trades & profit expander
- Refreshes every fifteen seconds while open: a row of summary statistics, a table of open positions, and a table of recent closes with the reason each was closed.
- Missing versus empty
- If the engine does not answer, the panel names which parts are missing. It never draws an unanswered panel as a zero.
Step by step
- 1New trading bot, then work through three steps: strategies, then what to trade, then size and risk.
- 2Add an exchange key if you have none. OKX also needs the passphrase you set when you created the key — not your account password. Give the key trade permission and no withdrawal permission; it is stored encrypted and never shown again.
- 3Fill in every risk field. Create stays disabled until they all have values, because a blank field used to mean the whole account.
- 4Create, and leave it on paper. Watch the Trades & profit panel until what it does looks like what you expected it to do.
- 5Retune it with Edit whenever the sizing or the pair list is wrong. Saving restarts the bot and keeps its history, so this is not a reason to rebuild one from scratch.
- 6Arm live when you are ready. The bot restarts with a fresh trade history, so the paper record does not carry over.
- 7Disarm to go back to paper, Stop to halt it without touching its setup, Delete to remove it and its container.
What the numbers mean
- Stake per trade
- Defaults to unlimited, which sizes each trade from the balance-deployed percentage. Type a number instead to fix it in USDT.
- Leverage and positions
- Leverage defaults to 3x within a 1–20 range; concurrent positions default to 5 within 1–20.
- Balance deployed
- The share of the account the bot may use, 1–100%, defaulting to 100.
- Stop loss and take profit
- Percentages from entry, defaulting to 5% and 10%.
- Entry and exit timeouts
- How long an unfilled order is allowed to sit, in minutes — six and five by default.
- Limits
- Five pairs and six strategies per bot, and four bots on the Trading Bot plan — roughly one per supported pair.
- Editing a pair that holds a position
- Removing a pair the bot currently has an open position on is refused, and the pair is named. A pair the bot no longer watches keeps its position but stops managing it — so the stop loss on it would no longer be enforced. Close the position first, then edit.
- When an edit takes effect
- New sizing applies to the next position the bot opens. Nothing already on the exchange is resized, and a stopped bot stores the change until you press Restart.
- Jurisdiction check
- Adding an exchange key and arming a bot are checked against where live trading is restricted, and are refused with a legal notice rather than a generic error. Disarming and stopping are never gated.
An armed bot can open a position before you look at the screen again. Size it for the account you actually have.
The Trading Bot plan. Without it the page shows what the plan does and what it would let you run, not an error.
Open Trading Bots →Dashboards
Whale
Where large accounts are positioned, and where price is being pulled.
A live board of tracked large accounts, the liquidation shelves that tend to act as magnets, and order-flow imbalance across seven exchanges.
Most of it arrives over a socket. On top of that the stat cards refresh every five seconds and the price chart every ten, so a tab left open all day stays current.
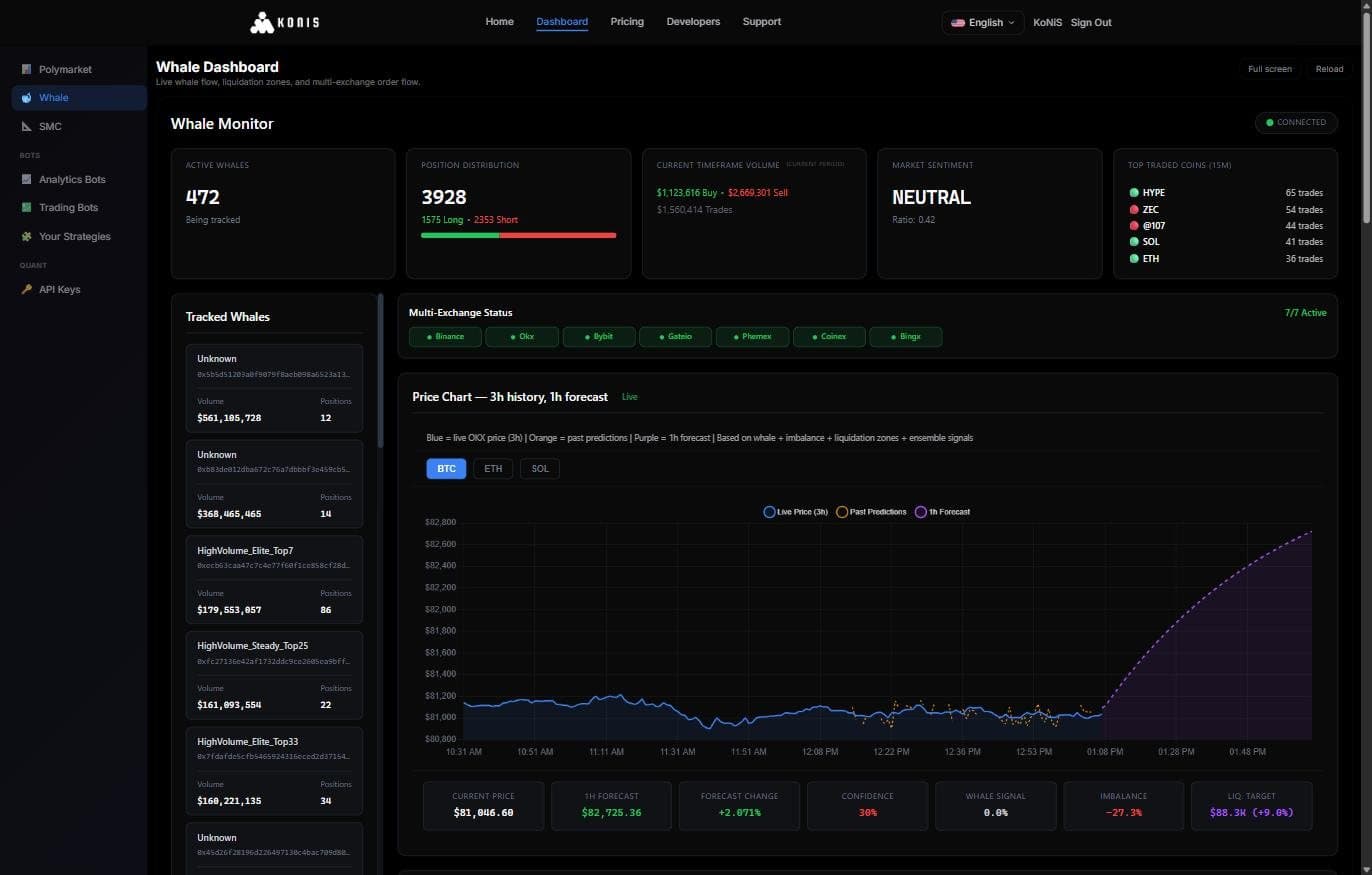
On the screen
- Five stat cards
- Accounts being tracked, the long/short split with its bar, buy and sell volume for the current window, market sentiment with its buy-to-sell ratio, and the most traded coins over fifteen minutes.
- Tracked Whales list
- Sorted by volume, largest first. Click one and the whole main area becomes that single account: its pairs, its position split, its recent activity. Click again to go back to the market view.
- Multi-exchange status
- Which of the seven venues are reporting right now. A missing venue changes what the imbalance cards below are averaging.
- Price chart — 3h history, 1h forecast
- Blue is live price, orange is past forecasts, purple is the forward one. The orange is the useful part: it lets you see how the forecasts aged before you lean on today's.
- Liquidation zones
- A heatmap over 1H to 7D, with long and short liquidation volume, the dominant zone, the magnet price, and how many exchanges fed it.
- Orderbook imbalance
- Buy versus sell pressure per exchange, then aggregated across timeframes with increasing, decreasing or stable markers.
Step by step
- 1Start on the market view. Read the sentiment gauge and the buy-to-sell ratio for the tape as a whole.
- 2Compare top traded coins at five minutes against fifteen. What changed between them is what is being bought now.
- 3Open liquidation zones for your symbol. Note the dominant shelf and the magnet price.
- 4Check that your stop is not sitting inside the heaviest shelf — that is the single most useful thing this screen does.
- 5Optionally click one whale to read a single account instead of the aggregate.
What the numbers mean
- Whale
- Not a trade size but a tracked account. They are discovered from the leaderboard at 500k or more account value and 2M or more daily volume, top 100, rescanned hourly, plus a curated list. Positions are polled every thirty seconds over a one-hour trade lookback.
- Sentiment
- A score from 0 to 100. Below 30 reads bearish, above 70 bullish, and the band between is the screen declining to call it.
- Magnet price
- The liquidation cluster price has the strongest pull toward. Treat it as a pressure point to plan around, not as a target to aim at.
- Whale trade
- In the prediction feed specifically, a single trade above 250,000 dollars.
Included with Pro, and with every tier above it. A locked account sees a blurred but real screenshot of the board behind the offer card, and a Preview button that dismisses the card so the layout can be inspected before buying.
Open Whale →Dashboards
SMC
Market structure, the liquidity map, and a measured entry.
Smart Money Concepts computed for BTC, ETH, SOL, XRP and gold: the bias, the structure event behind it, the levels, and an entry with its stop and two targets already measured.
Everything the panels quote is also drawn on the chart, so there is nothing to transcribe. It refreshes every eight seconds and keeps your zoom across refreshes.
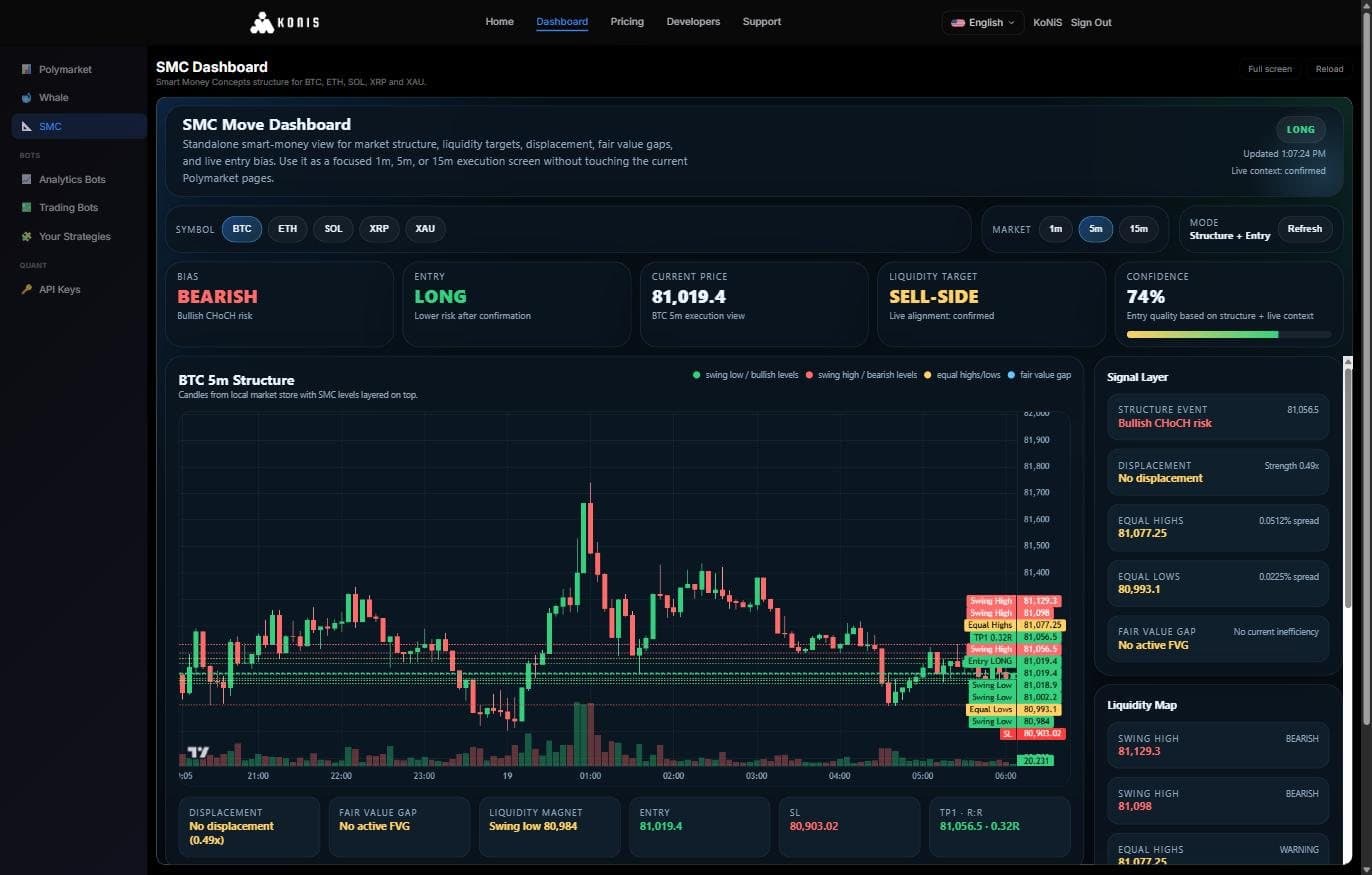
On the screen
- Entry pill
- LONG, SHORT or WAIT, with the update time and whether live context reads confirmed or mixed. Five beeps play whenever it flips into LONG or SHORT; clicking the pill replays them.
- Symbol and market chips
- BTC, ETH, SOL, XRP and XAU, at 1m, 5m or 15m. It opens on BTC at 5m.
- Five metric panels
- Bias with its structure event, entry with its risk note, current price, the liquidity target as buy-side or sell-side, and confidence with a fill bar.
- Structure chart
- Candles and volume with up to eight SMC levels as dashed lines, plus entry, stop, TP1 labelled with its R, TP2, and the edges of the fair value gap.
- Signal layer
- Structure event, displacement, equal highs, equal lows and fair value gap — each with its value and a one-line detail.
- Liquidity map
- Every level sorted from high price down, tagged bullish, bearish or warning.
- Live context
- A fast five-minute window and a slow fifteen-minute one side by side, each with prediction, weighted read, momentum, quality and imbalance.
Step by step
- 1Pick the symbol and the timeframe.
- 2Read the bias and the structure event that produced it.
- 3If the pill says WAIT, stop there. WAIT is an answer, not a missing one.
- 4If it says LONG or SHORT, check confidence and the risk note, and that live context reads confirmed rather than mixed.
- 5Take entry, stop and targets from the footnote row under the chart — they are the same levels already drawn on it.
- 6Cross-check the liquidity map so a target is not sitting on the wrong side of an equal-highs cluster.
What the numbers mean
- Displacement
- The last candle's body is at least 1.6 times the average of the previous five and closes in the top 35% of its range for bullish, or the bottom 35% for bearish. The strength figure shown is that multiple.
- Fair value gap
- A three-candle inefficiency: candle three's low above candle one's high, or the mirror image of that.
- Equal highs and lows
- Two swing points within 0.15% of each other. They matter because resting orders cluster there.
- BOS and CHoCH
- A break of structure is a close beyond the last swing. A change of character is a close creeping back through the opposite side, against the prevailing bias — the screen flags it as a risk rather than a reversal.
- Entry score
- Structure, displacement, the gap, liquidity and live context are weighted into a single number. LONG at +1.55 or above, SHORT at −1.55 or below, WAIT in between.
- Confidence
- Derived from that score and clamped to between 10% and 95%, which is why it never reads 0 or 100. The risk note only upgrades to lower-risk wording once the score is decisive.
- The levels
- Entry is the fair-value-gap midpoint when that sits within 1.5% of price, otherwise price itself. The stop is the last opposing swing with a 0.1% buffer, and the two targets are the next two opposing swings.
Included with Pro, and with every tier above it. Locked accounts get the same blurred-preview treatment as Whale.
Open SMC →Dashboards
Polymarket
The five-minute read on BTC, ETH, SOL and XRP.
This is the screen your account opens into. For the current five-minute window it publishes a direction, a confidence figure, and one gate that says whether conditions are clean enough to act on at all.
The chart underneath runs on the platform's own OKX-derived feed rather than an embedded third-party widget, so the candles and the read come from the same data.
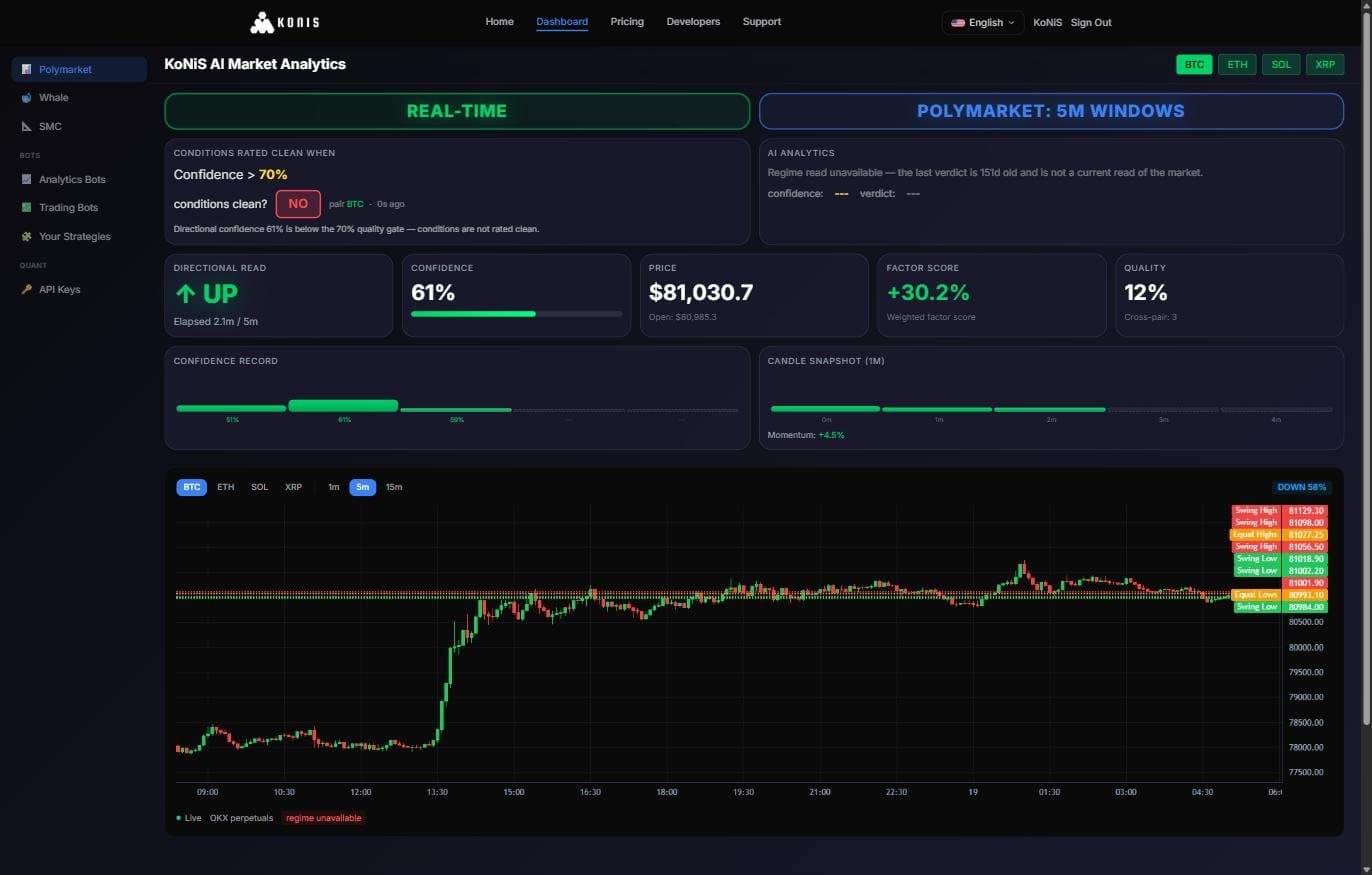
On the screen
- Pair tabs
- BTC, ETH, SOL, XRP. The colour is itself a signal — a tab tints green or red from that pair's own current read, so you can see the other three without leaving the one you are on. Pairs outside your plan carry a padlock.
- Real-time / Free mode banner
- Free accounts read the same data sixty seconds late and the banner says so. Paid accounts poll every two seconds and the banner turns green.
- Conditions gate
- The YES / NO box. It reads NO when the regime is choppy, and NO when confidence sits under the 70% bar. The line beneath always says which of the two it was.
- Five stat cards
- Directional read with how much of the window has elapsed, confidence with a bar, price against the window's open, the weighted factor score, and quality with the number of pairs agreeing.
- Confidence record
- One bar per elapsed minute of the window, coloured by that minute's direction. Read it for shape: conviction building across the window is a different thing from conviction fading.
- Candle snapshot
- The five one-minute bodies of the current window plus accumulated momentum.
- Live chart
- 1m, 5m and 15m, a prediction pill, a regime pill, and a connection badge that names your delay and any degraded source.
Step by step
- 1Pick the pair tab you want. The other tabs keep colouring themselves in the background.
- 2Read direction and confidence together. A direction without a confidence figure is not a read.
- 3Check the gate. If it says NO, read the reason line before deciding to override it.
- 4Glance at the confidence record. Rising bars mean the window is agreeing with itself as it goes.
- 5Use the chart underneath for timing, and the layer strips below it for whale flow and SMC levels if you hold those packs.
What the numbers mean
- Confidence
- How strongly the underlying factors agree with each other. The gate sits at 70% by default; below it the screen rates conditions unclean no matter how strong the direction looks.
- Quality
- Cross-pair agreement. A strong read on one pair that no other pair supports scores lower here — that is the number doing its job.
- Window
- Fixed at five minutes. The elapsed counter on the direction card tells you how much of it is already spent, which matters more than the direction late in a window.
- Stale verdict
- A regime read the backend marks out of date is thrown away rather than shown as current, and labelled with its age. If you see an age in days, that panel has nothing live to tell you.
Free accounts get BTC on a sixty-second delay. Paid plans remove the delay; the four-pair plans open ETH, SOL and XRP. Whale flow and SMC levels appear under the chart as locked strips until those packs are held — the data is stripped server-side, so a locked layer is genuinely absent rather than hidden.
Open Polymarket →Bots
Analytics Bots
Strategies drawn over live candles. No exchange key, no orders.
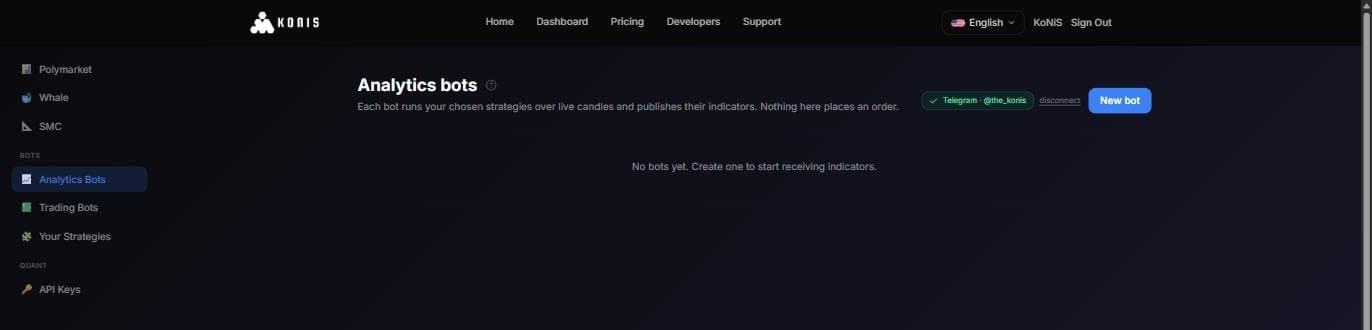
An analytics bot runs the strategies you pick over live OKX candles and publishes what they see, marked on a chart you can scroll.
It holds no exchange key and has no code path that places an order. Its entries can be pushed to your Telegram so they reach you with the page closed.
On the screen
- New bot
- Opens the two-step wizard. It greys out and explains itself once you are at your plan's bot count rather than failing after you have filled the form in.
- Bot cards
- Name, the pairs and timeframe on one mono line, a running, stopped or error badge, and the last error text if there was one.
- Card buttons
- A per-bot Telegram alerts toggle, indicators, restart, stop and delete. The alerts toggle flips instantly and reverts itself if the server refuses.
- Indicator legend
- One chip per indicator, each with a colour dot matching its line on the chart. Click a chip to take that line off the chart; a link brings the hidden ones back.
- The chart
- Candles with the strategy's own indicators drawn over them, a Heikin Ashi toggle for reading trend rather than price, and a count of long and short markers in view.
- ‹ SIGNAL › buttons
- Jump to the nearest entry either side of the current view, so you never drag through hours of quiet candles looking for one.
Step by step
- 1New bot, then choose your strategies. A bot runs one strategy version at a time, so picking one version greys out the others.
- 2Name it and pick the pairs. The timeframe is shown but not chosen — it belongs to the strategy, because a strategy analysed at one cadence will not signal at another.
- 3Create it, then give it a minute or two. It downloads candles and runs the strategies before the first indicators can appear, and says so while it works.
- 4Read the chart: green arrows are long entries, red are shorts. Use ‹ SIGNAL › to move between them.
- 5Connect Telegram once if you want entries to reach you while the page is closed. It uses the platform's bot, so there is no token to paste.
What the numbers mean
- Per-bot limits
- Up to five pairs and six strategies in one bot.
- Timeframe
- Fixed by the strategy. The reference strategies are analysed at five minutes; KoNiS V3 at four hours.
- Bot count
- Starter runs one bot at a time, Pro up to four. The Trading Bot and Bots & Quant plans include four.
- Prices on the chart
- When a chart shows prices as the strategy left them rather than exchange candles, the footer says so rather than letting the two be confused.
Signals are information, not advice. What you do with them is your decision.
An Analytics Bot plan, bundled with the Trading Bot and Bots & Quant plans. Without one the page is replaced by what the plan does, not by an error.
Open Analytics Bots →Quant
API Keys
The same signals, over HTTP, into your own code.
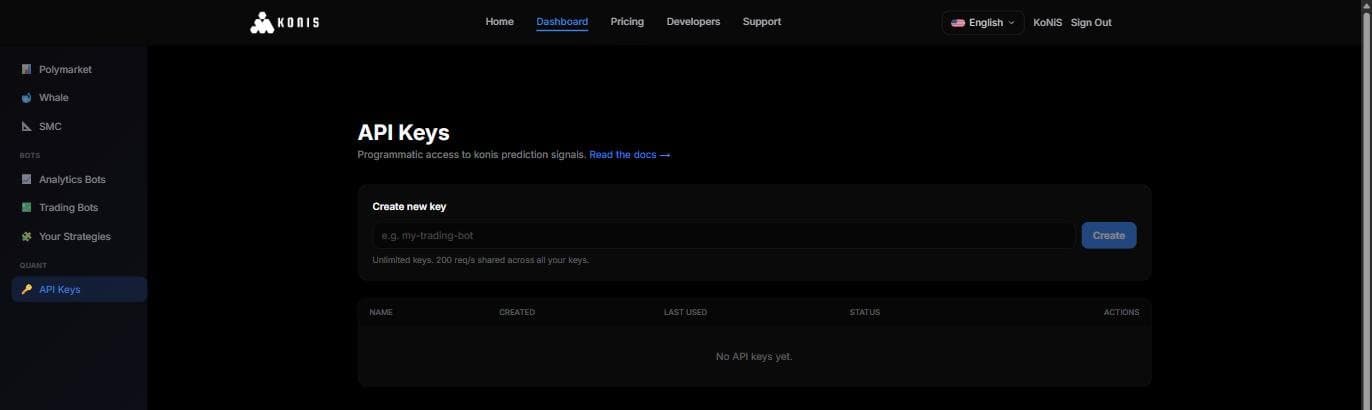
Create keys, watch what each one is calling, and revoke any of them. The key is shown once, at creation, because only its hash is stored.
Keys authenticate the prediction endpoints — the same reads the dashboards draw, without the dashboard.
On the screen
- Create new key
- A name and nothing else. The name is for you — it is how you will know which key to revoke later.
- The one-time reveal
- The new key appears once in a banner with a copy button. It cannot be shown again; if you lose it, revoke it and make another.
- Key table
- Name, created, last used and status, with revoke in the same row. Revoking is immediate and cannot be undone for that key.
- Usage
- Per key, over a day, week, month, year or all time: a per-day bar chart and a breakdown of which endpoints that key called.
Step by step
- 1Name the key after the thing that will use it, and create it.
- 2Copy it immediately and put it wherever you keep secrets.
- 3Send it as the X-Api-Key header — not as an Authorization bearer token, which is only for the dashboard's own session.
- 4Call the base URL https://konis.ai/api/v7 and the endpoint you need.
- 5Watch the usage chart to see which key is doing what, and revoke anything you no longer recognise.
What the numbers mean
- Key format
- A ka_ prefix followed by random hex. Only a hash of it is ever stored, which is why the reveal happens once.
- Rate limit
- 200 requests per second, shared across every key on your account rather than granted per key. Going over returns a 429 that says so.
- Endpoints
- Current prediction for one symbol or all of them, prediction history as JSON or CSV, the hyper-prediction reads, and an open health check. Symbols are BTC, ETH, SOL and XRP.
- Number of keys
- Unlimited. Separate keys per script cost nothing and make revoking one of them harmless.
Creating keys needs the Bots & Quant plan. The full request and response reference, with curl, JavaScript and Python examples, lives on the Developers page.
Open API Keys →Still stuck?
Every page carries a ? beside its title that reopens the short intro for that screen, so nothing in this guide is information you can only get here.