A backtest is a claim about arithmetic, not about the future. That makes it checkable — which means it can be wrong in ways that have nothing to do with whether the strategy is any good.
We found three in ours. All three inflated. None was a typo; each was a reasonable-looking construction that measured something other than what the number was going to be read as. Here they are with the working, because the only useful version of this post is the one you can check.
1. Sharpe was annualised as though the strategy never left the market
The old code scaled a per-trade Sharpe by how many trades of that length would fit in a year:
trades_per_year = MINUTES_PER_YEAR / average_duration_minutes
return (mean / stdev) * math.sqrt(trades_per_year)
Read that carefully. It asks "if trades this long ran back to back, how many would there be?" — which is the right question only if the strategy is always holding something.
Take a trend strategy that makes 40 trades a year and holds each for about three days. It is in the market roughly a third of the time.
implied pace   525600 / 4320  = 122 trades/year   scale = sqrt(122) = 11.0
actual pace                      40 trades/year   scale = sqrt(40)  =  6.3
The reported Sharpe was 1.74× the real one. That is not a rounding error. It is the difference between a number you would publish and a number that is indistinguishable from noise.
The two agree exactly when a strategy is always in a position, and diverge by
1/sqrt(exposure) when it is not — so the error is largest for exactly the
patient, selective strategies that a Sharpe is supposed to reward.
The fix is to divide by the calendar span the run actually covered:
trades_per_year = len(returns) * MINUTES_PER_YEAR / span_minutes
And because a reader cannot interpret a Sharpe without knowing how much of the
time capital was at risk, exposure is now reported beside it. A Sharpe earned
in 4% of the time is a different claim from the same Sharpe earned in 90%.
2. Total return compounded trades that overlapped in time
compounded = 1.0
for r in returns:
    compounded *= 1.0 + r
Chaining returns like that says each trade was the whole account, taken one after another. With ten positions open at once, it is neither a fixed-stake sum nor a time-weighted portfolio return — it is a third thing that resembles both and equals neither, and the error grows with trade count and with concurrency.
The replacement is an equity curve on the time axis, ordered by close, and additive rather than compounded. The comment in the new code says why: compounding down a list of trades that overlapped would credit the account with reinvesting money it had not been paid yet.
There is a second bug hiding in the same place. Without a starting balance, a four-pair run measures return per stake committed rather than return on the account — so a four-pair strategy reads as four times its real return on capital unless you pass the balance in. It is now passed in wherever the account size is known.
3. Max drawdown was measured over the trade list, not over time
The old function walked the returns in list order. But drawdown is a property of an equity curve in time: concurrent losers land together and dig one hole, whereas walking a list spreads them into several shallow ones.
This was the most expensive of the three, and not because it is the largest. Drawdown is the number a person actually reacts to — it is what makes someone turn a bot off at the worst possible moment. Understating it means the strategy's worst day arrives as a surprise.
The fix falls out of the second one for free: the same time-ordered equity curve, with the deepest peak-to-trough fall read off it.
What is now true, and what still is not
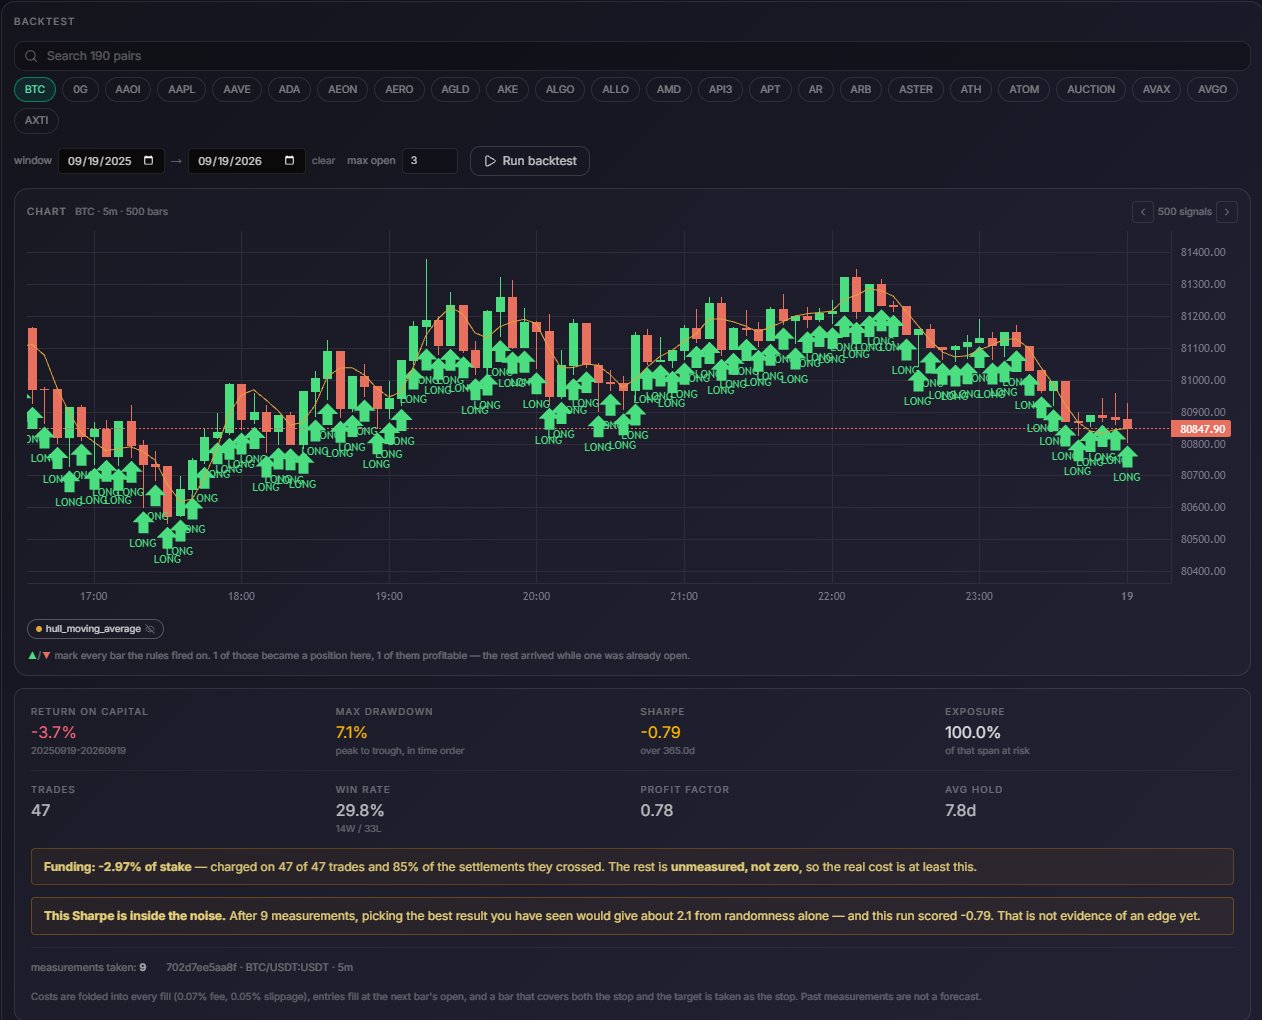 The same panel after the fixes, on a run that did not work. Sharpe is divided by the calendar span and carries exposure beside it, drawdown is read off the time-ordered curve, and the funding line says the real cost is at least this because 15% of the settlements could not be found. A report that can only produce flattering numbers is not a measurement.
All three are fixed and covered by tests. Sharpe divides by the real calendar span and reports exposure; the equity curve is additive and time-ordered; drawdown is read off that curve. Funding is charged from real settlement data, and where a rate could not be found the report names how many trades that was, rather than charging them zero and calling the total complete.
What is still not true: every stored figure measured before the fix carries the old numbers. Fixing the code does not retroactively fix results already computed, and a re-run is the only thing that does. So the honest state is "the arithmetic is right, the archive is not yet" — which is a less satisfying sentence than "we fixed it", and the accurate one.
The part worth stealing
None of these was found by staring at the code. They were found by asking what the number would be read as, and then checking whether the arithmetic computed that.
A Sharpe is read as risk-adjusted return per year of this strategy running. A total return is read as what the account did. A drawdown is read as the worst it felt. Write down the sentence each figure will be read as, then check the arithmetic against the sentence rather than against your intent. All three of ours passed code review and failed that test.
If you run backtests, the cheapest version of this exercise is to divide two
numbers you have never thought to divide: your reported Sharpe by
sqrt(exposure). If the result changes your mind about the strategy, the
number was carrying a claim it had not earned.