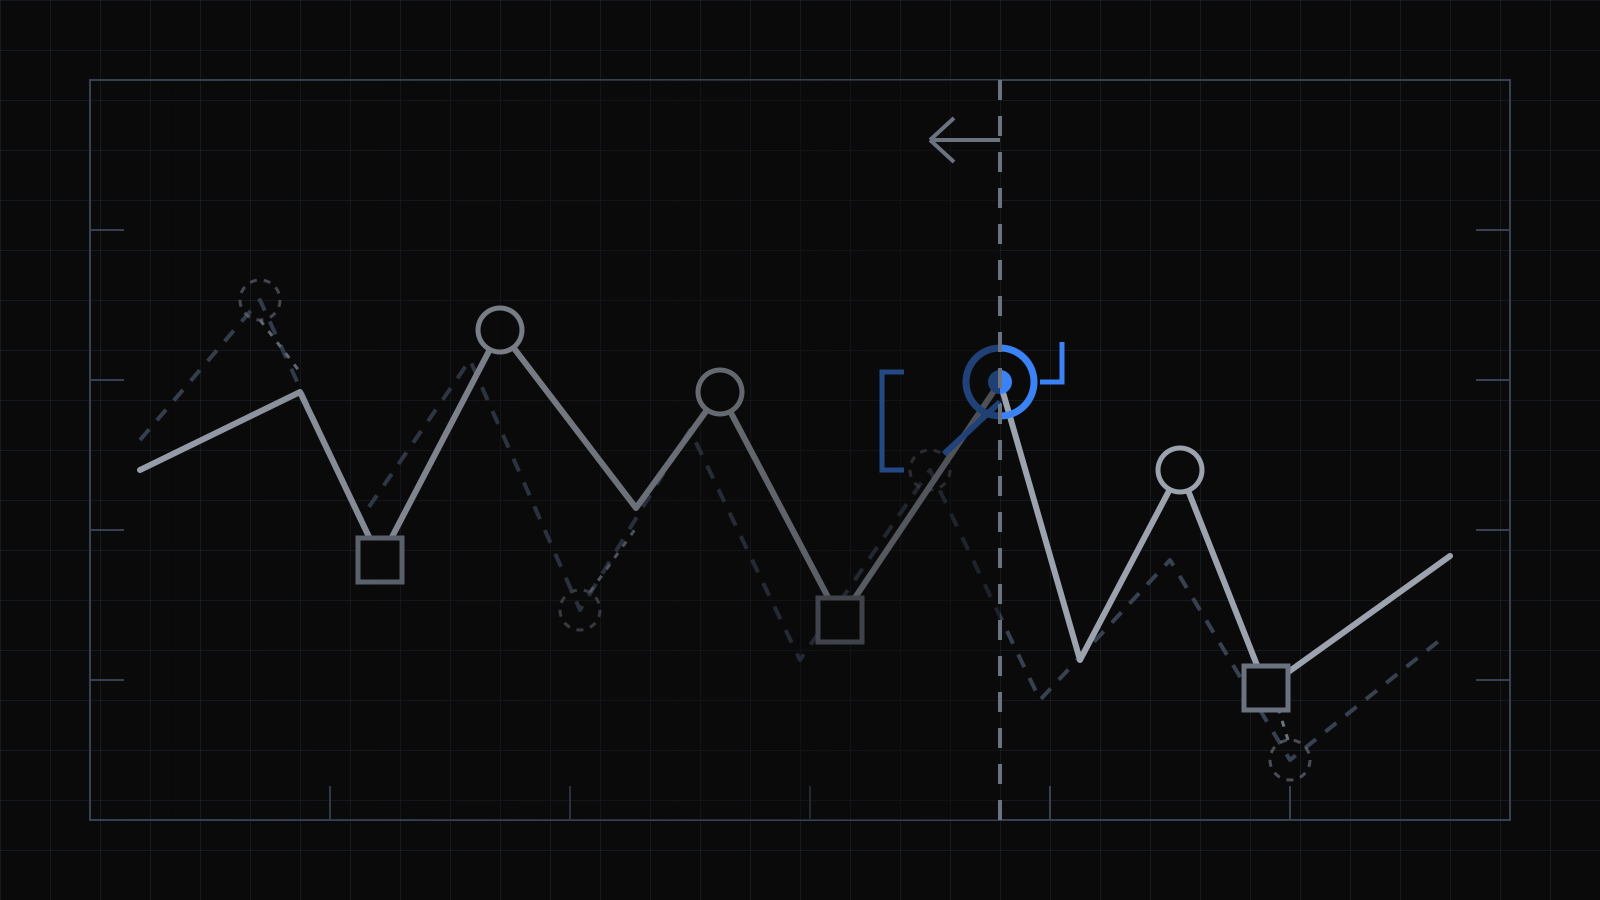
"Repainting" usually means one thing: the value at bar i was computed from a bar at i+1 or later. You find it by reading the code for a negative shift, and you fix it by shifting forward.
There is a second fault that reads no future price at all and still rewrites history. The value at bar i depends on how many bars came after i — not on their content, just on their count. Append one candle, recompute, and bar 449 comes back with a different number. Nothing in the computation ever touched bar 450.
The rule I will hold everything here to:
An indicator is reproducible only if the value at bar i depends on bars ≤ i and nothing else — not on the length of the frame you passed in.
The lookahead check does not catch violations of that rule. A truncation check does, and almost nobody runs one.
What follows is the working on a real port. The module is konis_core/strategy/peak_trough_transforms.py — Đỉnh 1 / Đáy 1, a peak-and-trough definition recovered from a strategy file deleted at 783c2d4377. It takes the extreme of the candle body (max(open, close) above, min(open, close) below) over an asymmetric window, then holds that level until something beats it by at least 0.4 × ATR(14). The module docstring is headed THREE DEPARTURES FROM THE ORIGINAL and then lists four. The fourth is the one that changes a number.
Departure 1: the chunking is gone
Here is the original, verbatim, building the units it processes:
# Chunked rolling window: process entire df in isolated windows, backward from newest
# Window size from config (default to N = process all at once)
window_size = self.config.get("konis_no_fresh_candles", N)

# Build windows backward: newest first (e.g., 449-499, 398-448, ...)
windows = []
end_idx = N - 1
while end_idx >= 0:
    start_idx = max(0, end_idx - window_size + 1)
    windows.append((start_idx, end_idx))
    end_idx = start_idx - 1
The anchor is N - 1. Everything is measured from the newest candle backward. konis_no_fresh_candles is 51 in user_data/config-okx-trader-konis-v1.json and 103 in user_data/config-okx-analyzer-konis-v1.json; take 51 and run the loop on a 500-bar frame, then on the same frame plus one candle.
| # | N = 500 | N = 501 |
|---|---|---|
| 1 | 449–499 | 450–500 |
| 2 | 398–448 | 399–449 |
| 3 | 347–397 | 348–398 |
| 4 | 296–346 | 297–347 |
| 5 | 245–295 | 246–296 |
| 6 | 194–244 | 195–245 |
| 7 | 143–193 | 144–194 |
| 8 | 92–142 | 93–143 |
| 9 | 41–91 | 42–92 |
| 10 | 0–40 | 0–41 |
Nine windows of 51 plus a remainder, both times: 9 × 51 = 459, leaving 41 bars in the 500-bar frame and 42 in the 501-bar frame. Every boundary except the one pinned at index 0 moved by exactly one.
Which bars land in a different chunk. Nine of them: 41, 92, 143, 194, 245, 296, 347, 398, 449. Each was the first bar of a window and becomes the last bar of the next older one. That is the small number. The large number is 459 — every bar in the nine newest windows now sits under a different win_start, and win_start is not decoration, it is an argument:
for win_start, win_end in windows:
    for i in range(win_start, win_end + 1):
        # Need at least 6 candles from window start for scan functions
        if i >= win_start + 6:
            peak1_raw[i]   = _scan_peak1_center(i, win_start)
            trough1_raw[i] = _scan_trough1_center(i, win_start)
It reaches inside the scan as a floor:
min_j = max(3, window_start + 3)
and it reaches into the running-level pass as a reset:
for win_start, win_end in windows:
    # Each window starts fresh (no carry from other windows)
    for i in range(win_start, win_end + 1):
        if i == win_start:
            prev_peak = np.nan
            prev_trough = np.nan
Bar 449, twice
Same candle, same open/high/low/close, same 449 candles of history in front of it.
In the 500-bar frame, bar 449 is win_start of window 1. Two things follow. The guard i >= win_start + 6 evaluates to 449 >= 455, which is false, so peak1_raw[449] is NaN — no pivot centre is even looked for. And i == win_start, so prev_peak = np.nan: the running level throws away 449 bars of ratcheting and restarts from this bar's own body.
In the 501-bar frame, bar 449 is the last bar of window 2 (399–449), at offset 50. 449 >= 399 + 6 is true, so the scan runs: _scan_peak1_center(449, 399) walks j from 446 down to min_j = 402 looking for a pivot centre. And the running level has carried forward through all 51 bars of that window.
One is a fresh body value. The other is the product of fifty-one bars of ATR-gated ratcheting plus a pivot scan over forty-five candidate centres. Add fifty more candles and bar 449 changes again.
The warmup holes move too. Six bars per window get no scan (win_start … win_start + 5), so 60 of the 500 bars have no pivot centre computed. In the 500-bar frame those holes start at 0, 41, 92, …, 449; in the 501-bar frame, at 0, 42, 93, …, 450. Nine bars that had no centre acquire one, and nine that had one lose it, because a candle arrived at the other end of the frame.
None of this is lookahead. No future price is read anywhere in it. It is still a result that cannot be reproduced, which for a backtest is the same disease.
The port drops the chunking entirely: one forward pass over the whole frame. The answer at bar i is the same wherever the data ends, which is what test_peak_and_trough_are_causal demands.
Departure 2: the centre scan is vectorised
The chunking was not gratuitous — it was buying something. The scan it wrapped is quadratic:
def _scan_peak1_center(i: int, window_start: int = 0) -> float:
    M = dataframe["muc_gia_duoc_xet_tren"].values
    j = i - 3
    min_j = max(3, window_start + 3)
    while j >= min_j and j + 2 <= i:
        t0 = M[j]; t1 = M[j+1]; t2 = M[j+2]
        l1 = M[j-1]; l2 = M[j-2]; l3 = M[j-3]
        if (t1 <= t0) and (t2 <= t1) and (l1 <= t0) and (l2 <= l1) and (l3 <= l2):
            return float(t0)
        j -= 1
    return float("nan")
Called once per bar, walking backward, worst case i - 6 steps. Summed over a frame that is N²⁄2 six-comparison tests. For the ~500 candles a live bot holds unchunked, that is about 125,000 — you will never notice it. A year of 5m data is 365 × 24 × 12 = 105,120 bars, and 105,120²⁄2 ≈ 5.5 × 10⁹. That is the actual motivation for the windows: a loop that was free on the live frame is not free on the historical one, and chunking it capped the walk at window_size instead of at i.
But look at what the test in that loop reads: M[j-3] through M[j+2]. Six cells around j. Nothing in the predicate depends on i at all. i only decides which qualifying j you stop at — the most recent one at or before i - 3.
A predicate that is local in j can be evaluated for every j at once:
is_peak = (
    (u.shift(-1) <= u) & (u.shift(-2) <= u.shift(-1))
    & (u.shift(1) <= u) & (u.shift(2) <= u.shift(1)) & (u.shift(3) <= u.shift(2))
)
is_trough = (
    (l.shift(-1) >= l) & (l.shift(-2) >= l.shift(-1)) & (l.shift(-3) >= l.shift(-2))
    & (l.shift(1) >= l) & (l.shift(2) >= l.shift(1)) & (l.shift(3) >= l.shift(2))
)

peak = u.where(is_peak).shift(CONFIRM_BARS).ffill()
trough = l.where(is_trough).shift(CONFIRM_BARS).ffill()
"The most recent qualifying centre at or before i - 3" is exactly a shift followed by a forward fill. One pass instead of N of them, and the answer is identical — test_the_pivot_centres_match_the_original_scan asserts it against the transcribed backward walk at rtol=0, atol=0.
The comparisons are <= and >=, not < and >, so a flat run qualifies as a centre. That is the original's behaviour and changing it would move levels on every doji.
The negative shifts look like exactly the thing we are trying to avoid, so: u.shift(-1) at row j is bar j+1, which is the confirmation bar for a centre at j, and the whole series is then shifted forward by CONFIRM_BARS = 3 before any bar reads it. A peak centre needs two bars after it, a trough centre needs three, and three covers the slower of the two. The shift lives inside pivot_centres rather than at each call site specifically so it cannot be forgotten at one of them. test_a_centre_is_never_read_before_it_is_confirmed plants a single spike at bar 30 and asserts the first bar reporting it is bar 33.
Departure 4: the trough scan actually runs
The third departure is one line and deliberate: a NaN ATR is treated as zero, so during the first 14 bars the 0.4 × ATR gate is wide open. That is the original's behaviour and it is preserved because changing it would silently alter the first candles of every window somebody has already looked at.
The fourth is not cosmetic. Here is the trough scanner from V5.5.2:
def _scan_trough1_center(i: int, window_start: int = 0) -> float:
    L = dataframe["muc_gia_duoc_xet_duoi"].values
    j = i - 2
    # j-3 must be >= window_start for isolated window
    min_j = max(3, window_start + 3)
    while j >= min_j and j + 3 <= i:
        ...
        j -= 1
    return float("nan")
Evaluate the guard on the first pass. j = i - 2, so j + 3 = i + 1, and the condition is:
i + 1 <= i
False for every integer i. It is a while, not a for with a filter — the loop exits before its first iteration, j is never decremented, and control falls straight through to return float("nan"). Not sometimes. For every bar of every frame, with any window_start, on any data.
Compare the peak scanner two functions above it: j = i - 3, guard j + 2 <= i, which is i - 1 <= i — true. The peak starts three bars back and needs two bars of confirmation. The trough starts two bars back and needs three. The start index and the confirmation depth were off by one in opposite directions, and the guard closed on itself.
What that did to the number
trough1_raw was NaN everywhere, so the pivot-centre term of the trough level never contributed anything. The chart was not blank, though, because the running level has two ways to move and only one of them was dead:
- the body itself exceeds the standing level (alive), or
- a newly confirmed pivot centre sits beyond it (dead for troughs).
So V5.5.2's trough1 was a step function of body minima with an ATR gate and no pivot term at all, while peak1 had both. The written spec describes them as mirror images. The code was asymmetric for the life of the version.
Plainly, then: our troughs do not match the old V5.5.2 charts, and they cannot. Peaks do — bar for bar, atol=1e-12, across three seeds. Troughs do not, because reproducing them would mean reproducing a loop whose guard was false on the first check. The port starts the trough scan at i - 3, as the peak does, which is what the spec says.
That is a real cost, and it is somebody's decision rather than ours to make silently. So both behaviours are pinned by tests in tests/claude/test_peak_trough_matches_v5_5_2.py, and reverting is a one-line change:
test_the_trough_scan_in_v5_5_2_never_runsholds the bug in place so nobody "restores fidelity" by reintroducing it. It runs the transcribed original twice, with the scan starting ati - 2and ati - 3, and asserts the first producesNaNfor all 900 bars while the second finds more than 500 centres.test_the_levels_match_the_original_bar_for_bar, parametrised over seeds 1, 7 and 42, compares the port against the transcribed original atrtol=0, atol=1e-12— peaks against V5.5.2 as written, troughs against V5.5.2 as specified, with the parametertrough_startnaming which is which.test_peak_and_trough_are_causalcuts the frame at 300, 517 and 740 bars, recomputes, and requires the overlap to be bit-identical for all four outputs. This is the test the original could not pass at any cut.test_the_atr_is_a_simple_mean_not_wilderschecks the threshold arithmetic, because V5.5.2 averages true range arithmetically and the obvious library call smooths exponentially.
The generator behind them rounds prices to two decimals on purpose, so identical bodies actually occur. With <= and >= in the predicate, a data generator that never repeats a price would let a strict-inequality bug pass every assertion.
The mechanism, in one line
peak = u.where(is_peak).shift(CONFIRM_BARS).ffill()
where marks the centres, shift(3) moves each one to the first bar entitled to know about it, ffill carries it forward. Nothing in the module reads a bar later than the one being computed, and nothing in it reads len(frame).
The truncation test is worth more than the code review here. Lookahead you can find by eye. A dependence on frame length hides inside an optimisation that was correct on the frame it was written for — five hundred candles, live, where the window covers everything and the boundaries never bite — and only becomes a reproducibility bug when the same function is handed a year of history. If you add one test to an indicator, cut the frame in half and assert the overlap is unchanged.